A withdrawal plan is an overall strategy that determines when and how all sources of retirement income will be withdrawn.
A good plan is organized, sustainable, and tax-efficient. It ensures you have enough money for your entire retirement—and the peace of mind to enjoy it.
My Game Plan offers you a personalized withdrawal plan based on the information you entered in the tool. Here's how to view it.
Chart: Your cash inflows over time
How to access the chart
- After entering as much information as possible (situation, income, government benefits, pension plan, savings, expenses, etc.), go to the Dashboard in the left menu.
- Scroll down to the chart.
- The chart Your cash inflows over time should appear by default. If you see a different chart, change the view by clicking the three dots at the top right of the section.
The chart also appears in the Recommendations section.
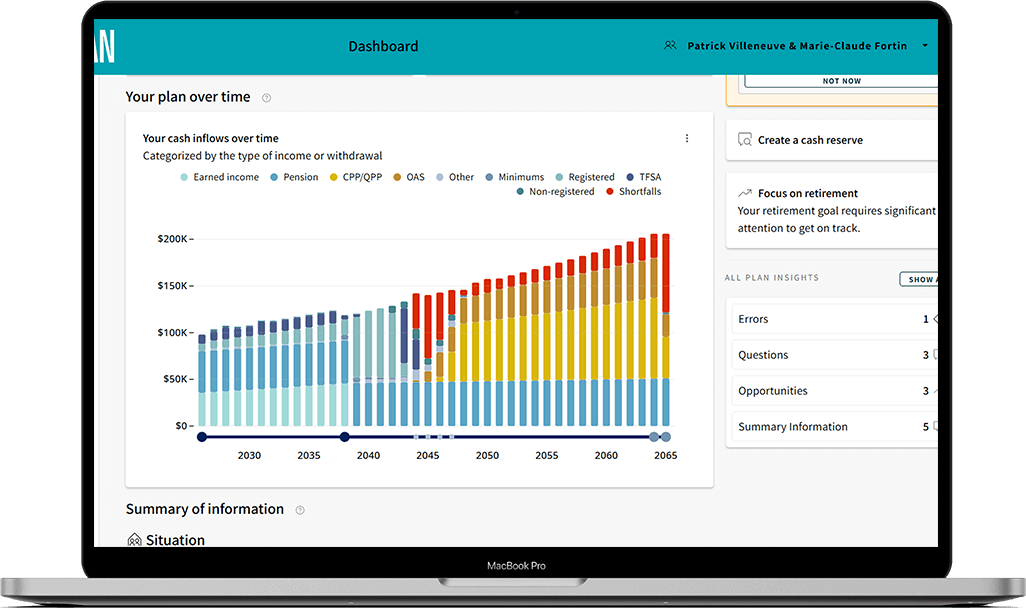
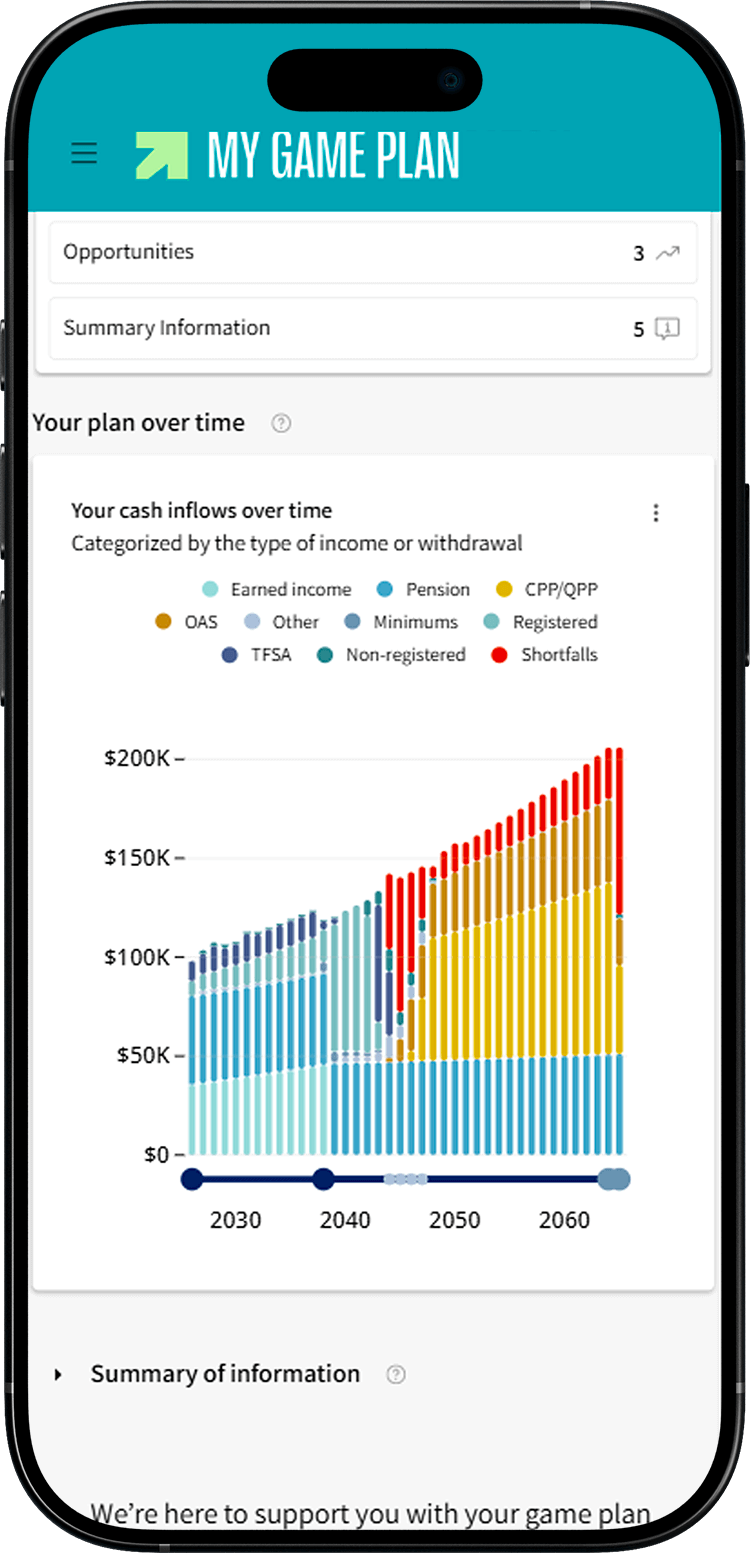
How to read the chart
- Each vertical bar represents a year.
- The colors indicate the different income sources (pension plans, CPP/QPP, TFSA, etc.).
- Hover over a bar or tap it to see the amount tied to an income source.
- Hover over or tap the horizontal axis (the years) to see key life moments, such as retirement, the start of a government benefit, or the end of a repayment.
- The chart projects over your entire lifetime. If you added a spouse or partner, it extends to the estimated death of the last person.

Good to know: When you're retired, the Your cash inflows over time chart also appears in the overview of your online account. Check it anytime you want!
Why does income increase over the years?
Government retirement benefits (QPP and OAS) are indexed to the cost of living. They therefore increase slightly each year.
In addition, My Game Plan assumes that your expenses will gradually rise due to inflation and adjusts your withdrawals accordingly.
What are shortfalls?
Shortfalls represent the amount missing to cover your expenses for a given year. They appear in red on the chart.
Note that projections are based on the information you entered today, especially your monthly expenses. This amount could decrease over time if you have fewer activities, travel less, or move to a smaller home, for example. Shortfalls could therefore decrease or disappear.
Concerned? Contact an advisor to review your plan and explore strategies to improve it.
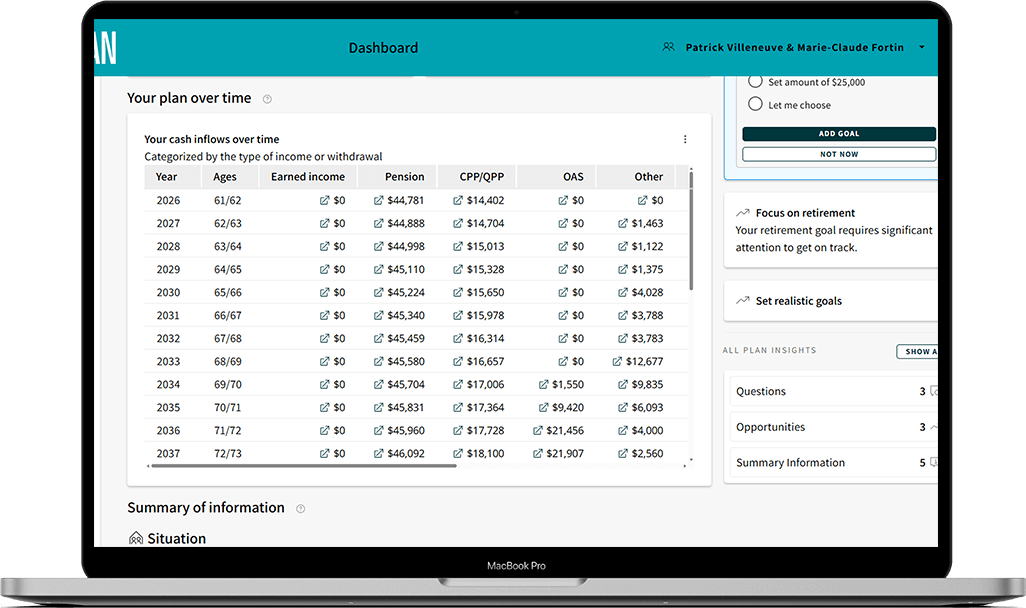
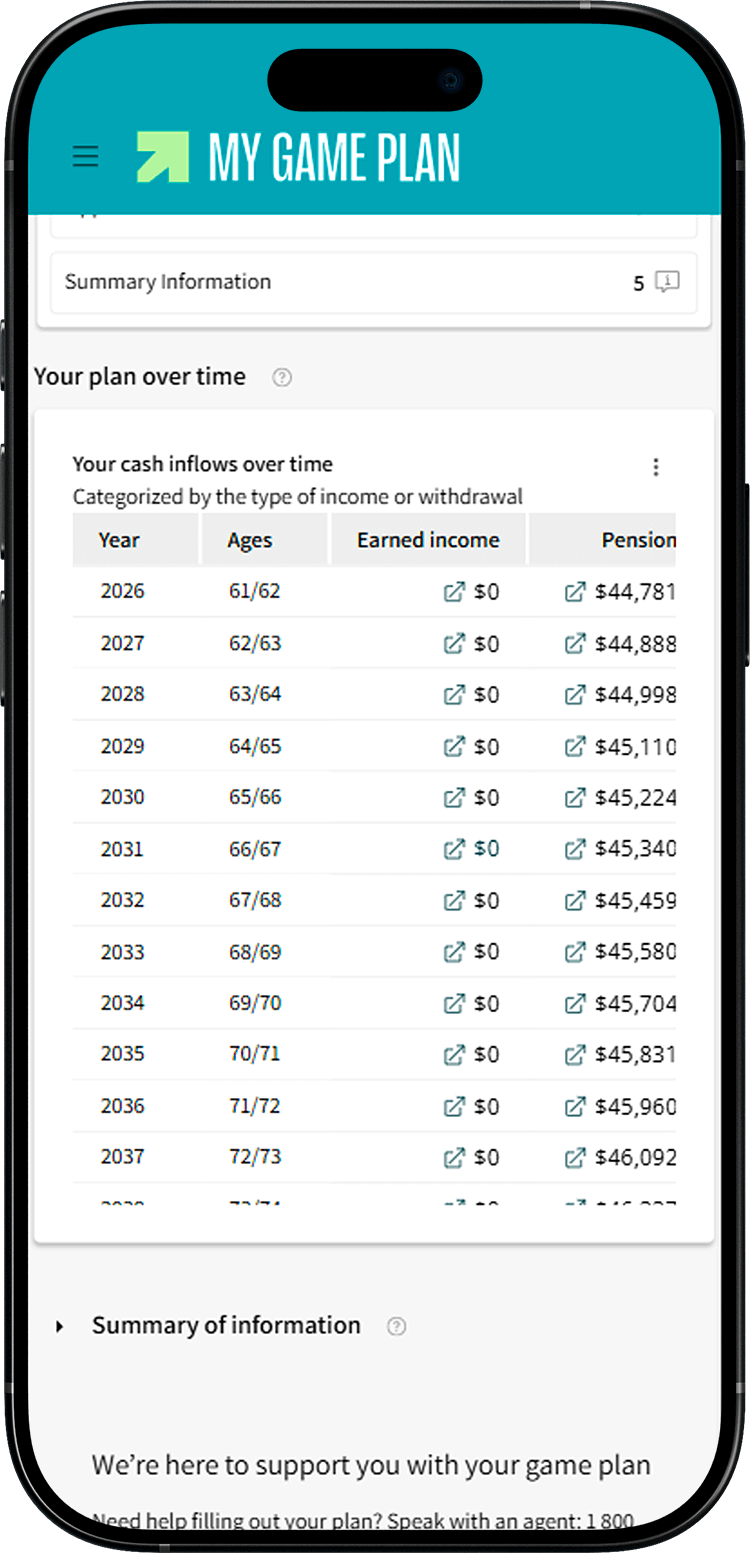
Withdrawal table
See at a glance how much to withdraw from which income source using the table view. To access it:
- Open the Your cash inflows over time chart.
- Click the three dots at the top right of the section.
- Select the Table option.
All the details in your personalized report
Want to learn more? Download your complete plan using the button at the top right of your dashboard. You'll get a PDF financial story with all detailed projections.
Your withdrawal plan is in the Gross cash flow projection section. Also, the recommendations you selected to help you achieve your goals appear in the Action plan section.
Need help clarifying your plan?
The FlexiFonds mutual fund advisors are here to help. Contact the team for free, pressure‑free human support.
Monday to Thursday, 9 a.m. to 8 p.m., and Friday, 9 a.m. to 5 p.m.